Et innovativt verktøy fra Google tilbyr testing og gir råd om hvordan du kan forbedre ytelse, SEO, sikkerhet, beste praksis og tilgjengelighet for din nettside.
Google har nylig introdusert Lighthouse, et åpen kildekode-verktøy som gjør det mulig å revidere nettsiden din både manuelt og automatisk.
Hvilke kriterier måler Google Lighthouse?
Verktøyet sjekker over 75 ulike faktorer og genererer en samlet poengsum. Som eier av en nettside, SEO-analytiker eller webmaster, kan du være spesielt interessert i følgende sentrale områder:
- Ytelse – Lastetid, responstid, hastighetsindeks, optimalisering av ressurser, TTFB (Time to First Byte), levering av eiendeler, skriptkjøringstid og DOM-størrelse, med mer.
- SEO – Mobilvennlighet, meta-informasjon, indeksering, kanoniske lenker, struktur og mer.
- Beste praksis – Bildeoptimalisering, bruk av JS-biblioteker, feillogging i nettleseren, sikkerhet med HTTPS, kjente sårbarheter i JavaScript osv.
- Tilgjengelighet – Elementer på siden, språk, ARIA-attributter osv.
- PWA (Progressiv Webapplikasjon) – Omdirigering fra HTTP til HTTPS, statuskode OK, rask lastetid på 3G, startskjermbilde, viewport og mer.
Dette er et utmerket verktøy som kan brukes på mange forskjellige måter.
Ja, det stemmer – det er mange bruksområder. Utviklere kan for eksempel bruke Node.js til å utføre tester programmatisk. I tillegg finnes det allerede flere verktøy på markedet som bruker Lighthouse for å tilby kontinuerlig overvåking av nettsideytelse.
La oss se nærmere på hvordan du kan utføre en Lighthouse-test på din egen nettside.
Vi starter med den enkleste metoden.
Måling via web.dev
Google lanserte web.dev for noen måneder siden, og det har raskt blitt populært. Det er en enkel måte å teste nettsider på.
Gå til Måle-siden og skriv inn URL-en du ønsker å analysere. Etter noen få sekunder vil du motta en detaljert rapport med en total poengsum.
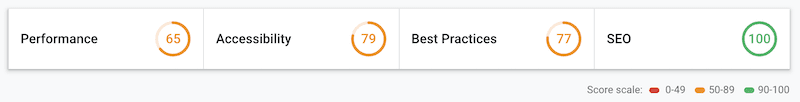
Resultatene viser både de områdene hvor nettsiden har bestått testen og de områdene som krever forbedring.
Ikke fokuser for mye på å oppnå 100 poeng. Selv Googles egne nettsider scorer ikke alltid perfekt.
Se heller på resultatene som retningslinjer og arbeid med å forbedre nettsiden din så mye som mulig.
Merk: web.dev simulerer en test ved hjelp av en mobil enhet, og i skrivende stund ser det ikke ut til å være et alternativ for å teste med en datamaskin.
Chrome
Visste du at Lighthouse også er tilgjengelig direkte i Chrome-nettleseren? En fordel er at du kan velge å teste enten med en mobil eller en datamaskin, og det er tilgjengelig i utviklerverktøy.
- Åpne Chrome-nettleseren.
- Gå til nettsiden du ønsker å teste.
- Åpne utviklerverktøy (trykk F12 i Windows) eller høyreklikk på siden og velg «Inspiser».
- Gå til fanen «Revisjoner».
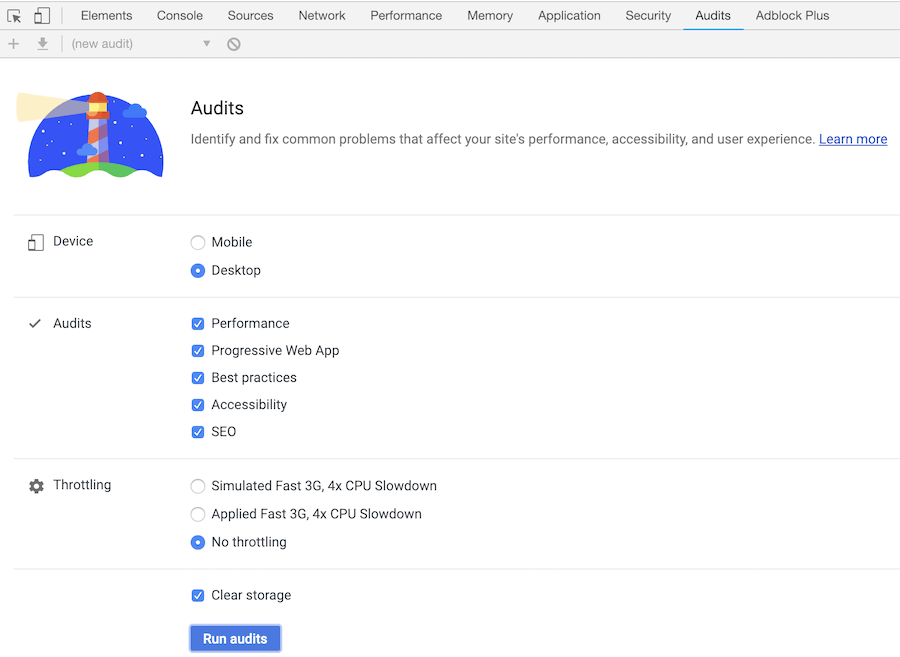
Som du ser ovenfor, kan du velge hva du vil teste. Dette er nyttig for å fokusere på spesifikke mål og få raskere resultater.
Resultatene fra Chrome og web.dev er tilnærmet like.
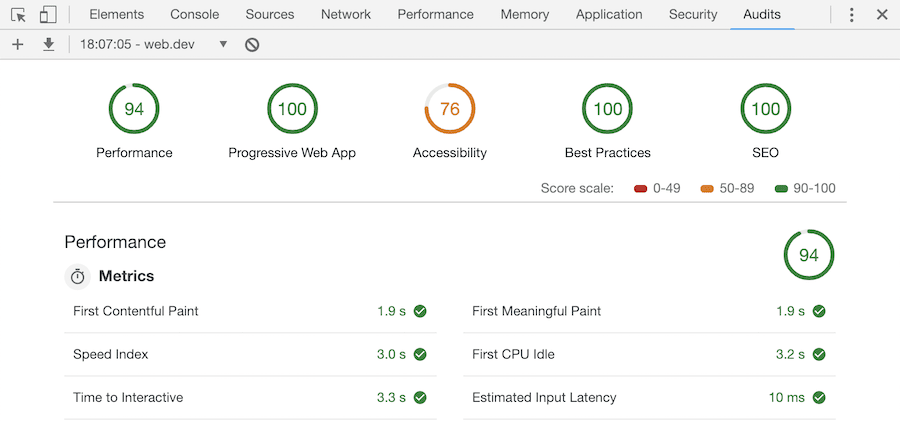
Men hvis du ser nøye etter, finnes det en ekstra kategori her – Progressive Web App. Dette er en ekstra grunn til å gjennomføre revisjon med Chrome.
tipsbilk.net Lighthouse API
Det er også mulig å hente ut data om nettytelse ved hjelp av tipsbilk.net Lighthouse API. Dette gir deg tilgang til Lighthouse-beregninger for mobil eller datamaskin med ett enkelt klikk, i HTML-, JSON- eller CSV-format.
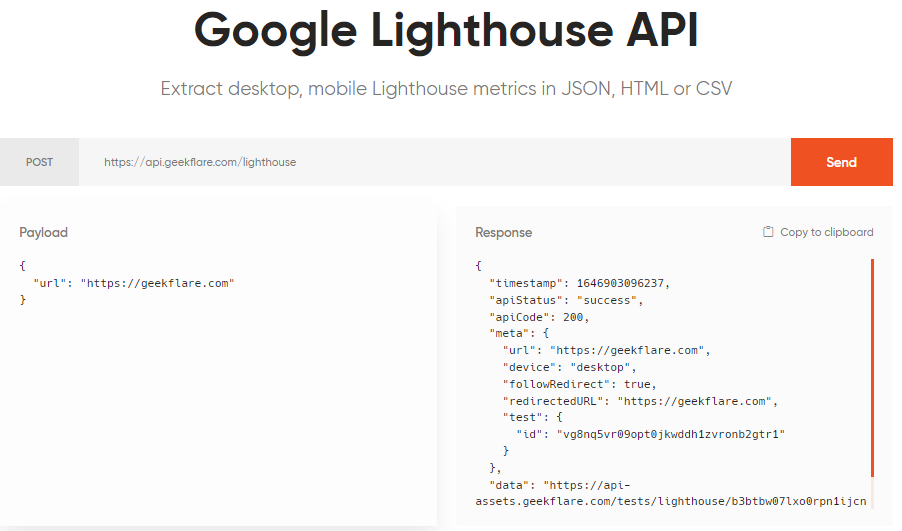
Du kan også tilpasse rapporten ved å endre utdataformat og/eller fokusere på spesifikke kategorier, som for eksempel SEO.
{
  "parameters": [
      "--output=html",
      "--only-categories=seo",
  ],
  "url": "example.com"
}
Det finnes også et gratis abonnement som gir 3000 API-kall per måned. De betalte abonnementene gir tilgang til flere lokasjoner, proxy-tjenester for privat bruk og høyere forespørselshastigheter, og starter på bare $5 i måneden.
Node.js
Lighthouse er også tilgjengelig som en Node-modul. Du kan installere den på serveren din og bruke den programmatisk eller via kommandolinjen. La oss se på hvordan du installerer Lighthouse for å kjøre tester.
Installere Lighthouse på Ubuntu 18.x
Følgende instruksjoner er testet på en DigitalOcean server. Lighthouse krever Node LTS 8.9 eller nyere, og jeg forutsetter at du allerede har dette installert. Hvis ikke, kan du se en installasjonsveiledning for Node.js.
Du trenger også en Chromium-nettleser installert på serveren. Installasjonsinstruksjoner finnes her.
Det er enkelt å installere Lighthouse, akkurat som andre moduler.
- Logg inn på serveren din.
- Kjør følgende kommando for å installere:
npm install -g lighthouse
Jeg bruker -g her, slik at den installeres som en global modul.
[email protected]:~# npm install -g lighthouse
/usr/bin/lighthouse -> /usr/lib/node_modules/lighthouse/lighthouse-cli/index.js
/usr/bin/chrome-debug -> /usr/lib/node_modules/lighthouse/lighthouse-core/scripts/manual-chrome-launcher.js

> [email protected] postinstall /usr/lib/node_modules/lighthouse/node_modules/axe-core
> node build/utils/postinstall.js

+ [email protected]
added 179 packages from 119 contributors in 10.094s
[email protected]:~#
Etter installasjonen, kjør Lighthouse-kommandoen for å verifisere at den er installert korrekt.
[email protected]:~# lighthouse
Please provide a url

Specify --help for available options
[email protected]:~#
Flott, Lighthouse er klar til å kjøre revisjoner. La oss teste noen alternativer.
For å kjøre en test med en «headless» nettleser:
lighthouse URL --chrome-flags="--headless"
Du må oppgi en absolutt URL, inkludert HTTP eller HTTPS.
Eksempel:
[email protected]:~$ lighthouse https://tipsbilk.net.com --chrome-flags="--headless"
  ChromeLauncher Waiting for browser. +0ms
  ChromeLauncher Waiting for browser... +1ms
  ChromeLauncher Waiting for browser..... +511ms
  ChromeLauncher Waiting for browser.....✓ +2ms
  status Connecting to browser +176ms
  status Resetting state with <a href="https://tipsbilk.net.com/aboutblank-in-chrome-firefox-safari/">about:blank</a> +24ms
  status Benchmarking machine +30ms
  status Initializing… +508ms
  status Loading page & waiting for onload Scripts, CSSUsage, Viewport, ViewportDimensions, ThemeColor, Manifest, RuntimeExceptions, ChromeConsoleMessages, ImageUsage, Accessibility, LinkElements, AnchorsWithNoRelNoopener, AppCacheManifest, Doctype, DOMStats, JSLibraries, OptimizedImages, PasswordInputsWithPreventedPaste, ResponseCompression, TagsBlockingFirstPaint, MetaDescription, FontSize, CrawlableLinks, MetaRobots, Hreflang, EmbeddedContent, Canonical, RobotsTxt +27ms
  status Retrieving in-page: Scripts +2s
  status Retrieving in-page: CSSUsage +0ms
  status Retrieving in-page: Viewport +0ms
  status Retrieving in-page: ViewportDimensions +0ms
  status Retrieving in-page: ThemeColor +0ms
  status Retrieving in-page: Manifest +0ms
  status Retrieving in-page: RuntimeExceptions +0ms
  status Retrieving in-page: ChromeConsoleMessages +0ms
  status Retrieving in-page: ImageUsage +0ms
  status Retrieving in-page: Accessibility +0ms
  status Retrieving in-page: LinkElements +0ms
  status Retrieving in-page: AnchorsWithNoRelNoopener +1ms
  status Retrieving in-page: AppCacheManifest +0ms
  status Retrieving in-page: Doctype +0ms
  status Retrieving in-page: DOMStats +0ms
  status Retrieving in-page: JSLibraries +0ms
  status Retrieving in-page: OptimizedImages +0ms
  status Retrieving in-page: PasswordInputsWithPreventedPaste +0ms
  status Retrieving in-page: ResponseCompression +0ms
  status Retrieving in-page: TagsBlockingFirstPaint +0ms
  status Retrieving in-page: MetaDescription +0ms
  status Retrieving in-page: FontSize +0ms
  status Retrieving in-page: CrawlableLinks +0ms
  status Retrieving in-page: MetaRobots +0ms
  status Retrieving in-page: Hreflang +0ms
  status Retrieving in-page: EmbeddedContent +0ms
  status Retrieving in-page: Canonical +0ms
  status Retrieving in-page: RobotsTxt +0ms
  status Retrieving trace +1ms
  status Retrieving devtoolsLog & network records +110ms
  status Retrieving: Scripts +27ms
  status Retrieving: CSSUsage +53ms
  status Retrieving: Viewport +192ms
  status Retrieving: ViewportDimensions +5ms
  status Retrieving: ThemeColor +13ms
  status Retrieving: Manifest +2ms
  status Retrieving: RuntimeExceptions +295ms
  status Retrieving: ChromeConsoleMessages +1ms
  status Retrieving: ImageUsage +2ms
  status Retrieving: Accessibility +22ms
  status Retrieving: LinkElements +526ms
  status Retrieving: AnchorsWithNoRelNoopener +10ms
  status Retrieving: AppCacheManifest +6ms
  status Retrieving: Doctype +20ms
  status Retrieving: DOMStats +4ms
  status Retrieving: JSLibraries +50ms
  status Retrieving: OptimizedImages +25ms
  status Retrieving: PasswordInputsWithPreventedPaste +234ms
  status Retrieving: ResponseCompression +3ms
  status Retrieving: TagsBlockingFirstPaint +7ms
  status Retrieving: MetaDescription +6ms
  status Retrieving: FontSize +7ms
  status Retrieving: CrawlableLinks +245ms
  status Retrieving: MetaRobots +6ms
  status Retrieving: Hreflang +2ms
  status Retrieving: EmbeddedContent +2ms
  status Retrieving: Canonical +3ms
  status Retrieving: RobotsTxt +6ms
  status Resetting state with about:blank +19ms
  status Loading page & waiting for onload ServiceWorker, Offline, StartUrl +24ms
  status Retrieving in-page: ServiceWorker +59ms
  status Retrieving in-page: Offline +0ms
  status Retrieving in-page: StartUrl +1ms
  status Retrieving devtoolsLog & network records +0ms
  status Retrieving: ServiceWorker +2ms
  status Retrieving: Offline +1ms
  status Retrieving: StartUrl +1ms
  status Resetting state with about:blank +5ms
  status Loading page & waiting for onload HTTPRedirect, HTMLWithoutJavaScript +48ms
  status Retrieving in-page: HTTPRedirect +260ms
  status Retrieving in-page: HTMLWithoutJavaScript +0ms
  status Retrieving devtoolsLog & network records +0ms
  status Retrieving: HTTPRedirect +7ms
  status Retrieving: HTMLWithoutJavaScript +12ms
  status Disconnecting from browser... +7ms
  status Analyzing and running audits... +6ms
  status Evaluating: Uses HTTPS +3ms
  status Evaluating: Redirects HTTP traffic to HTTPS +24ms
  status Evaluating: Registers a service worker that controls page and start_url +1ms
  status Evaluating: Current page responds with a 200 when offline +0ms
  status Evaluating: Has a `<meta name="viewport">` tag with `width` or `initial-scale` +1ms
  status Evaluating: Contains some content when JavaScript is not available +1ms
  status Evaluating: First Contentful Paint +6ms
  status Evaluating: First Meaningful Paint +54ms
  status Evaluating: Page load is fast enough on mobile networks +10ms
  status Evaluating: Speed Index +33ms
  status Evaluating: Screenshot Thumbnails +529ms
  status Evaluating: Final Screenshot +287ms
  status Evaluating: Estimated Input Latency +2ms
  status Evaluating: No browser errors logged to the console +16ms
  status Evaluating: Server response times are low (TTFB) +1ms
  status Evaluating: First CPU Idle +1ms
  status Evaluating: Time to Interactive +30ms
  status Evaluating: User Timing marks and measures +0ms
  status Evaluating: Minimize Critical Requests Depth +2ms
  status Evaluating: Avoid multiple page redirects +3ms
  status Evaluating: Web app manifest meets the installability requirements +2ms
  status Evaluating: Configured for a custom splash screen +1ms
  status Evaluating: Sets an address-bar theme color +0ms
  status Evaluating: Content is sized correctly for the viewport +1ms
  status Evaluating: Displays images with correct aspect ratio +0ms
  status Evaluating: Avoids deprecated APIs +1ms
  status Evaluating: Minimizes main-thread work +0ms
  status Evaluating: JavaScript execution time +11ms
  status Evaluating: Preload key requests +3ms
  status Evaluating: Preconnect to required origins +2ms
  status Evaluating: All text remains visible during webfont loads +2ms
  status Evaluating: Network Requests +1ms
  status Evaluating: Metrics +2ms
  status Evaluating: start_url responds with a 200 when offline +1ms
  status Evaluating: Site works cross-browser +1ms
  status Evaluating: Page transitions don't feel like they block on the network +0ms
  status Evaluating: Each page has a URL +0ms
  status Evaluating: `[aria-*]` attributes match their roles +1ms
  status Evaluating: `[role]`s have all required `[aria-*]` attributes +1ms
  status Evaluating: Elements with `[role]` that require specific children `[role]`s, are present +0ms
  status Evaluating: `[role]`s are contained by their required parent element +1ms
  status Evaluating: `[role]` values are valid +1ms
  status Evaluating: `[aria-*]` attributes have valid values +0ms
  status Evaluating: `[aria-*]` attributes are valid and not misspelled +1ms
  status Evaluating: `<audio>` elements contain a `<track>` element with `[kind="captions"]` +1ms
  status Evaluating: Buttons have an accessible name +1ms
  status Evaluating: The page contains a heading, skip link, or landmark region +1ms
  status Evaluating: Background and foreground colors have a sufficient contrast ratio +1ms
  status Evaluating: `<dl>`'s contain only properly-ordered `<dt>` and `<dd>` groups, `<script>` or `<template>` elements. +1ms
  status Evaluating: Definition list items are wrapped in `<dl>` elements +0ms
  status Evaluating: Document has a `<title>` element +1ms
  status Evaluating: `[id]` attributes on the page are unique +1ms
  status Evaluating: `<frame>` or `<iframe>` elements have a title +1ms
  status Evaluating: `<html>` element has a `[lang]` attribute +0ms
  status Evaluating: `<html>` element has a valid value for its `[lang]` attribute +1ms
  status Evaluating: Image elements have `[alt]` attributes +1ms
  status Evaluating: `<input type="image">` elements have `[alt]` text +1ms
  status Evaluating: Form elements have associated labels +0ms
  status Evaluating: Presentational `<table>` elements avoid using `<th>`, `<caption>` or the `[summary]` attribute. +1ms
  status Evaluating: Links have a discernible name +1ms
  status Evaluating: Lists contain only `<li>` elements and script supporting elements (`<script>` and `<template>`). +1ms
  status Evaluating: List items (`<li>`) are contained within `<ul>` or `<ol>` parent elements +1ms
  status Evaluating: The document does not use `<meta http-equiv="refresh">` +0ms
  status Evaluating: `[user-scalable="no"]` is not used in the `<meta name="viewport">` element and the `[maximum-scale]` attribute is not less than 5. +1ms
  status Evaluating: `<object>` elements have `[alt]` text +1ms
  status Evaluating: No element has a `[tabindex]` value greater than 0 +1ms
  status Evaluating: Cells in a `<table>` element that use the `[headers]` attribute only refer to other cells of that same table. +1ms
  status Evaluating: `<th>` elements and elements with `[role="columnheader"/"rowheader"]` have data cells they describe. +0ms
  status Evaluating: `[lang]` attributes have a valid value +1ms
  status Evaluating: `<video>` elements contain a `<track>` element with `[kind="captions"]` +1ms
  status Evaluating: `<video>` elements contain a `<track>` element with `[kind="description"]` +1ms
  status Evaluating: `[accesskey]` values are unique +1ms
  status Evaluating: Custom controls have associated labels +0ms
  status Evaluating: Custom controls have ARIA roles +1ms
  status Evaluating: User focus is not accidentally trapped in a region +0ms
  status Evaluating: Interactive controls are keyboard focusable +0ms
  status Evaluating: Headings don't skip levels +0ms
  status Evaluating: Interactive elements indicate their purpose and state +1ms
  status Evaluating: The page has a logical tab order +0ms
  status Evaluating: The user's focus is directed to new content added to the page +1ms
  status Evaluating: Offscreen content is hidden from assistive technology +0ms
  status Evaluating: HTML5 landmark elements are used to improve navigation +0ms
  status Evaluating: Visual order on the page follows DOM order +0ms
  status Evaluating: Uses efficient cache policy on static assets +1ms
  status Evaluating: Avoids enormous network payloads +3ms
  status Evaluating: Defer offscreen images +1ms
  status Evaluating: Eliminate render-blocking resources +12ms
  status Evaluating: Minify CSS +28ms
  status Evaluating: Minify JavaScript +64ms
  status Evaluating: Defer unused CSS +69ms
  status Evaluating: Serve images in next-gen formats +12ms
  status Evaluating: Efficiently encode images +11ms
  status Evaluating: Enable text compression +6ms
  status Evaluating: Properly size images +6ms
  status Evaluating: Use video formats for animated content +7ms
  status Evaluating: Avoids Application Cache +11ms
  status Evaluating: Page has the HTML doctype +0ms
  status Evaluating: Avoids an excessive DOM size +1ms
  status Evaluating: Links to cross-origin destinations are safe +2ms
  status Evaluating: Avoids requesting the geolocation permission on page load +1ms
  status Evaluating: Avoids `document.write()` +0ms
  status Evaluating: Avoids front-end JavaScript libraries with known security vulnerabilities +0ms
  status Evaluating: Detected JavaScript libraries +9ms
  status Evaluating: Avoids requesting the notification permission on page load +1ms
  status Evaluating: Allows users to paste into password fields +0ms
  status Evaluating: Uses HTTP/2 for its own resources +0ms
  status Evaluating: Uses passive listeners to improve scrolling performance +1ms
  status Evaluating: Document has a meta description +0ms
  status Evaluating: Page has successful HTTP status code +1ms
  status Evaluating: Document uses legible font sizes +5ms
  status Evaluating: Links have descriptive text +1ms
  status Evaluating: Page isn’t blocked from indexing +1ms
  status Evaluating: robots.txt is valid +2ms
  status Evaluating: Document has a valid `hreflang` +1ms
  status Evaluating: Document avoids plugins +1ms
  status Evaluating: Document has a valid `rel=canonical` +0ms
  status Evaluating: Page is mobile friendly +1ms
  status Evaluating: Structured data is valid +0ms
  status Generating results... +0ms
  ChromeLauncher Killing Chrome instance 7098 +59ms
  Printer html output written to /home/chandan/tipsbilk.net.com_2019-01-20_19-29-35.report.html +46ms
  CLI Protip: Run lighthouse with `--view` to immediately open the HTML report in your browser +1ms
I nest siste linje ser du at filbanen til rapporten vises. Standardinnstillingen er å generere en rapport i HTML-format, som du kan laste ned eller servere via en webserver.
Men hva om du trenger en rapport i JSON-format?
Det kan du enkelt gjøre med følgende kommando:
lighthouse URL --chrome-flags="--headless" --output json --output-path URL.json
Med Lighthouse CLI får du full kontroll og kan tilpasse bruken etter dine behov. Jeg anbefaler å sjekke ut GitHub-depotet for å lære mer om bruk av CLI eller programmatisk bruk.
Konklusjon
Google Lighthouse er et lovende verktøy for å utføre kontinuerlige tester og forbedre ytelsen og brukervennligheten til nettsider. Hvis du bruker WordPress og ønsker å akselerere lastehastigheten, kan du vurdere Rocket.